
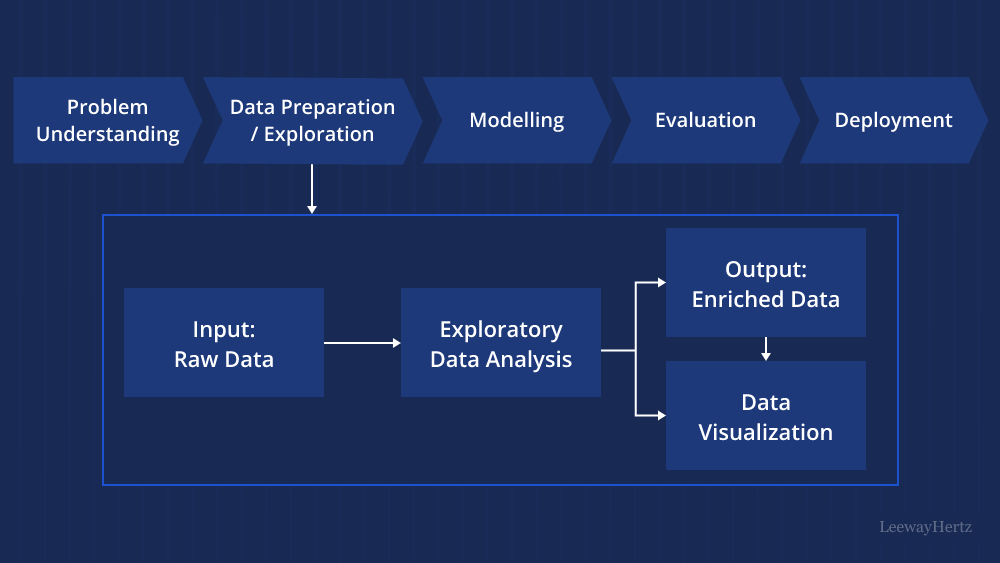
Exploratory Data Analysis (EDA) is a crucial phase in the data analysis process, where analysts and data scientists examine and explore datasets to gain insights, detect patterns, and identify potential relationships between variables. It is a vital step in understanding the structure and characteristics of the data before applying more complex modeling techniques. EDA provides a visual and statistical overview of the data, enabling researchers to make informed decisions and formulate hypotheses. In this article, we will delve into the fundamentals of Exploratory Data Analysis, its methods, and techniques.
1. Purpose of Exploratory Data Analysis:
The primary goal of Exploratory Data Analysis is to gain an understanding of the data distribution, its central tendencies, and the spread of the variables. By visualizing the data, analysts can identify any outliers, missing values, and potential errors, allowing them to clean and preprocess the data effectively. Additionally, EDA aids in selecting appropriate statistical methods and models for subsequent analysis, thereby improving the overall quality and reliability of the findings.
2. EDA Methods and Techniques:
a) Summary Statistics: One of the initial steps in EDA is computing summary statistics, which provide a quick glimpse into the data’s main characteristics. Common summary statistics include mean, median, standard deviation, minimum, maximum, and quartiles. These metrics give an overall idea of the data’s central tendencies and spread.
b) Data Visualization: Visualization is a fundamental aspect of EDA, as it enables analysts to comprehend complex patterns and trends quickly. Techniques such as histograms, box plots, scatter plots, line plots, and heatmaps help in representing data visually. Visualization is especially helpful in identifying outliers, clusters, and correlations between variables.
c) Histograms: Histograms display the distribution of a single variable by dividing it into bins and plotting the frequency of data points falling within each bin. They provide insights into data skewness, modality, and presence of outliers.
d) Box Plots: Box plots, also known as box-and-whisker plots, offer a visual representation of the data’s distribution and identify potential outliers. They display the median, quartiles, and extremes of the dataset, making it easier to compare different groups or variables.
e) Scatter Plots: Scatter plots are useful when examining the relationship between two continuous variables. They help to identify patterns, clusters, or correlations between the variables.
f) Line Plots: Line plots are suitable for visualizing trends and changes in data over time or across categories. They are frequently used to analyze time series data.
g) Heatmaps: Heatmaps are effective for displaying the correlation matrix between variables in a dataset. They use color gradients to show the strength and direction of relationships between variables.
h) Categorical Data Analysis: When dealing with categorical data, techniques such as bar charts and pie charts are used to visualize the distribution of data among different categories.
3. Data Preprocessing:
During the EDA process, data preprocessing plays a vital role. This step involves handling missing values, dealing with outliers, normalizing or scaling data, and encoding categorical variables. Effective data preprocessing ensures that the data is in a suitable format for analysis and modeling.
4. Interpreting Results and Drawing Conclusions:
Once the EDA process is complete, analysts can interpret the results and draw preliminary conclusions. They might identify interesting patterns, relationships, or trends that could lead to further investigation or hypothesis testing.
Conclusion:
Exploratory Data Analysis is a fundamental and indispensable step in the data analysis process. It allows analysts to understand their data thoroughly, discover patterns, and make informed decisions regarding data preprocessing and modeling. By utilizing various methods and techniques, EDA empowers data scientists to unlock valuable insights and knowledge hidden within the data. Effective EDA not only improves the quality of subsequent analyses but also aids in generating more accurate and reliable results, ultimately leading to better-informed decision-making processes.
To Learn More:- https://www.leewayhertz.com/what-is-exploratory-data-analysis/
