
In the era of big data, information has become the lifeblood of decision-making, be it in business, science, or everyday life. However, raw data is often like a puzzle waiting to be solved, and that’s where Exploratory Data Analysis (EDA) steps in. EDA is a crucial first step in data analysis, providing insights, revealing patterns, and guiding further investigations. In this article, we will delve into the world of EDA, its importance, techniques, and real-world applications.
The Essence of Exploratory Data Analysis
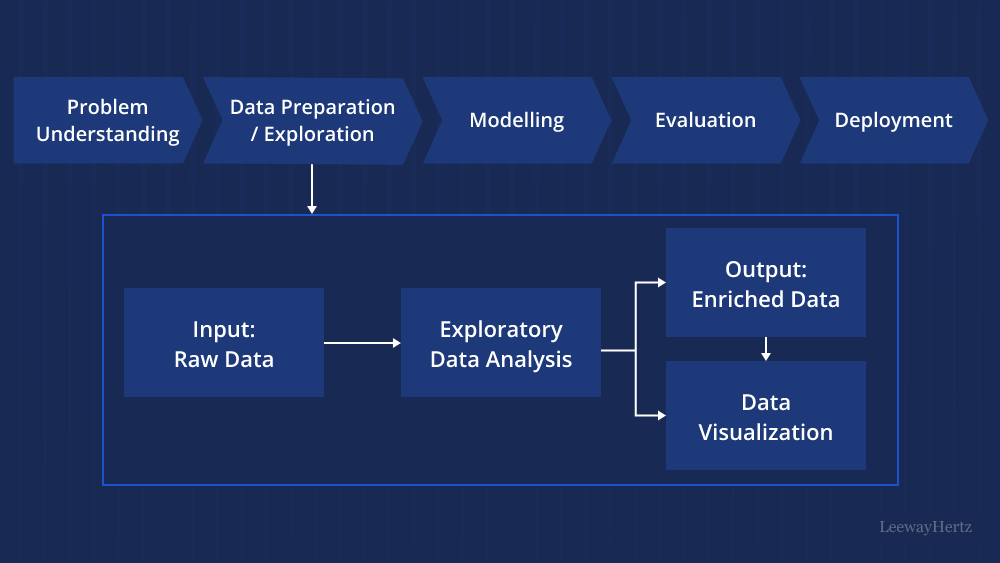
Exploratory Data Analysis is the process of summarizing and visualizing data to understand its structure, patterns, and relationships. It is a bridge that connects the raw data to meaningful insights. While some might see it as the appetizer before the main course of statistical modeling, EDA is, in fact, a valuable dish in itself. Here are some key reasons why EDA is indispensable:
- Data Understanding: EDA helps us get acquainted with our data. It allows us to see what’s there, what’s missing, and whether the data makes sense.
- Pattern Discovery: EDA can reveal hidden patterns and trends in the data. These patterns can be used for prediction, decision-making, and even innovation.
- Outlier Detection: It identifies outliers or anomalies in the data, which could be errors or valuable insights. Detecting these outliers can be crucial in various fields, from finance to healthcare.
- Data Cleaning: EDA often uncovers inconsistencies, missing values, and outliers that need to be addressed before more advanced analysis can take place.
Techniques and Tools of EDA
EDA employs a variety of techniques and tools to extract insights from data. Here are some common approaches:
- Descriptive Statistics: These provide a summary of the central tendency, dispersion, and shape of a dataset. Measures like mean, median, and standard deviation are essential in understanding the data’s basic characteristics.
- Data Visualization: Visualization techniques like histograms, scatter plots, and box plots help represent data graphically, making patterns and outliers more apparent. Tools like Matplotlib, Seaborn, and ggplot2 are invaluable for creating compelling visualizations.
- Correlation Analysis: This method examines the relationships between variables, showing how they move together or apart. Correlation coefficients like Pearson, Spearman, or Kendall can quantify these relationships.
- Dimensionality Reduction: Techniques like Principal Component Analysis (PCA) or t-Distributed Stochastic Neighbor Embedding (t-SNE) help reduce the complexity of high-dimensional data while preserving important information.
- Clustering and Anomaly Detection: Methods such as k-means clustering or Isolation Forest are used to group similar data points together or identify unusual observations.
- Time Series Analysis: When dealing with time-dependent data, EDA often involves methods like moving averages, autocorrelation, and seasonal decomposition to uncover underlying patterns.
Applications of Exploratory Data Analysis
EDA plays a pivotal role across various domains:
- Business and Marketing: EDA helps businesses understand customer behavior, optimize marketing strategies, and identify trends to make informed decisions.
- Healthcare: In medical research, EDA is used to uncover correlations between variables, identify patient clusters, and detect early signs of diseases.
- Finance: EDA is essential for risk assessment, fraud detection, and portfolio optimization in the financial sector.
- Environmental Science: Environmental data can be analyzed to understand trends in climate change, pollution levels, and the impact of human activities on ecosystems.
- Social Sciences: EDA assists social scientists in exploring survey data, identifying demographics, and understanding societal trends.
- Manufacturing and Quality Control: In manufacturing, EDA is used to monitor production processes, identify defects, and improve quality.
Challenges in Exploratory Data Analysis
Despite its benefits, EDA comes with challenges:
- Data Quality: Poorly collected or incomplete data can hinder the effectiveness of EDA.
- Biases: Unintentional biases in data collection can lead to misleading insights.
- Interpretation: EDA is an art as much as it is a science. Different analysts may interpret the same data differently, leading to varied conclusions.
- Data Privacy: Handling sensitive or personally identifiable information requires careful consideration and ethical practices.
Conclusion
Exploratory Data Analysis is not just a stepping stone but an essential component of data analysis. It transforms raw data into actionable insights, making it invaluable across diverse fields. As the world continues to generate vast amounts of data, the role of EDA in uncovering hidden stories within this data will only become more critical. So, the next time you encounter a dataset, remember the power of EDA in unraveling its secrets and guiding you towards data-driven decisions.
